Infection Management: Antimicrobials
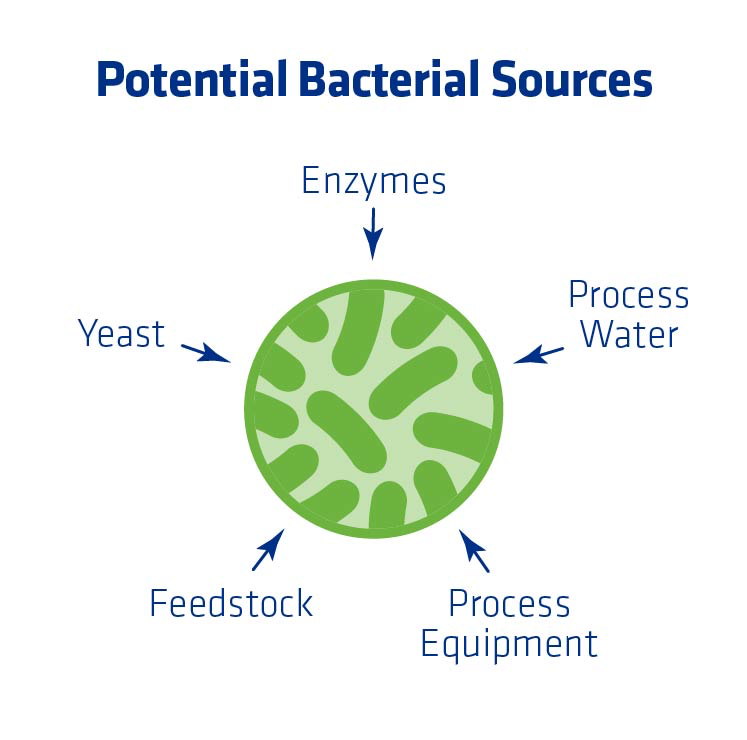
Bacteria are everywhere and a constant threat to fuel ethanol plants via the various sources listed in Figure 1 below. Plants can run a clean, pasteurized front end, but based on all existing plant designs it is not possible to keep corn mash completely sterile throughout the ethanol production process.
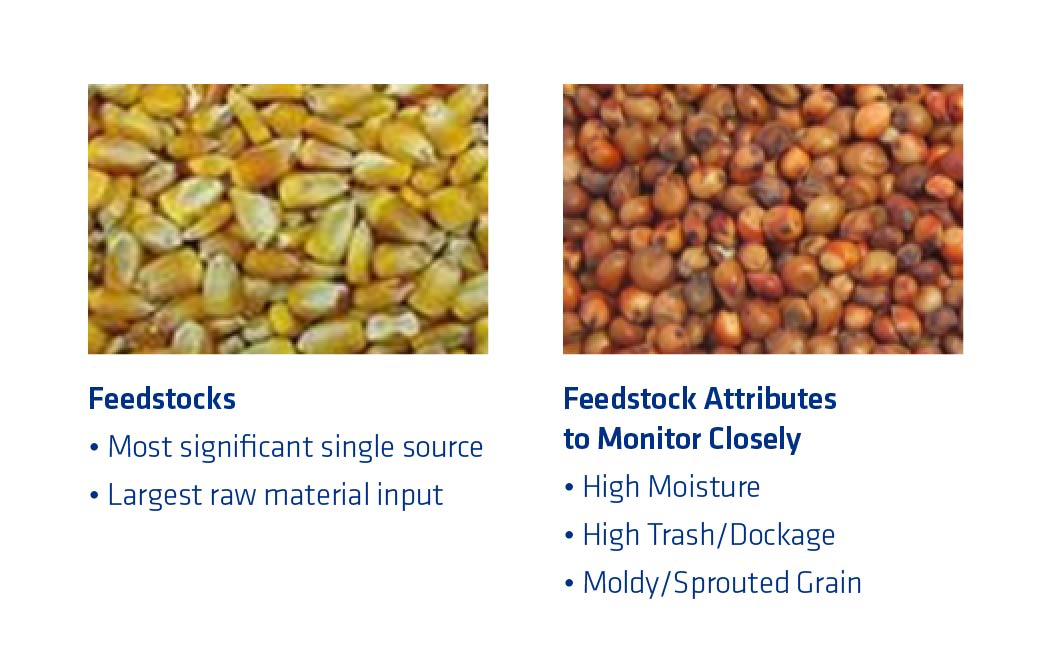
Feedstock
Since corn (and/or other grain) is an ethanol plant’s largest raw material input, it requires close monitoring of grain quality. High moisture, trash/dockage, and moldy or sprouted grain are all warning signs for someone receiving and analyzing grain for entry into the plant. Contaminated feedstock can be a particular problem around harvest time when farmers and grain elevators empty the old corn out of their bins. This old corn was likely stored in piles on the ground, or sat in a silo for an extended period of time with potentially little airflow. Additionally, it’s possible that low quality feedstock (especially high moisture) could bring already produced lactic acid into the process.
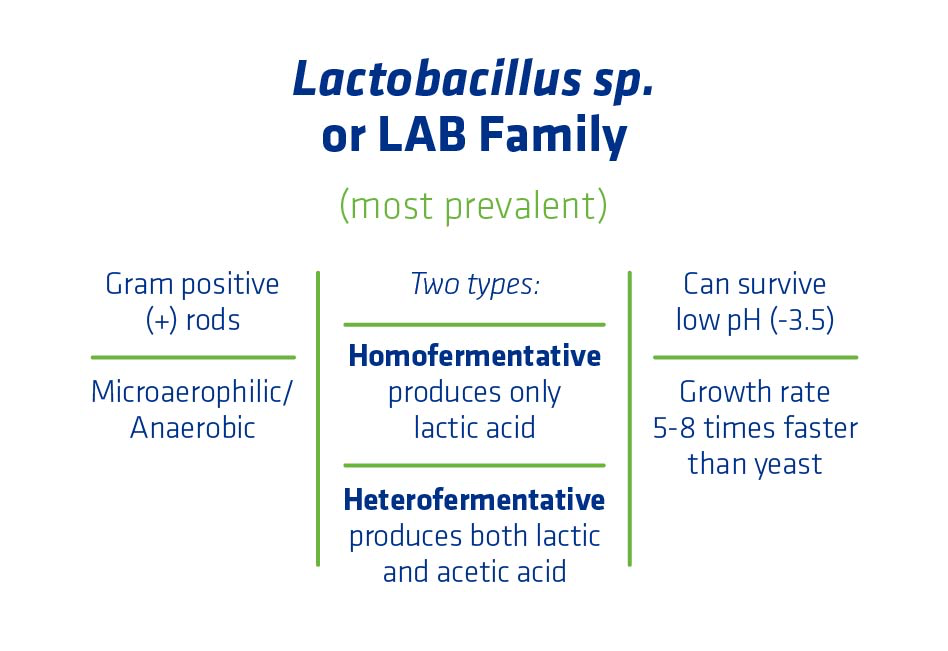
Most Prevalent Bacteria
Most of the bacteria present in an ethanol plant are from the Lactic Acid Bacteria (LAB) family. Lactobacillus species are the most common genus within the LAB family, but others may exist in an ethanol plant. Lactobacillus sp. are gram positive, rod-shaped bacterium. Gram positive describes characteristics of the bacterial cell wall, which can impact the antibiotics that will or won’t work on a species of bacteria. Gram negative bacteria also exist, but these typically grow in aerobic (oxygen rich) conditions and are a rarely found in a quantifiable amount in fuel ethanol plants.
Lactic Acid Bacteria survive well at a low pH (~3.5) and their growth rate is 5–8 times faster than yeast. As a result, just one bacterial cell can become a million cells in only a few hours. LAB grow both in the presence of small amounts or the absence of oxygen, which are conditions found everywhere in a plant.
There are two types of LAB:
- Homofermentative – Only make lactic acid.
- Heterofermentative – Make lactic acid and something else, usually acetic acid.
Treatment Options
Chemical additives or natural products are a plant’s two options for bacterial control. Antibiotics are highly specific, only targeting bacteria. In contrast, chemical additives such as bleach or chlorine dioxide are not selective and therefore increase the risk of damaging or killing yeast present in the process. Finally, chemical additives lose potency because they react with other components in mash such as protein and/or starch (organic load).
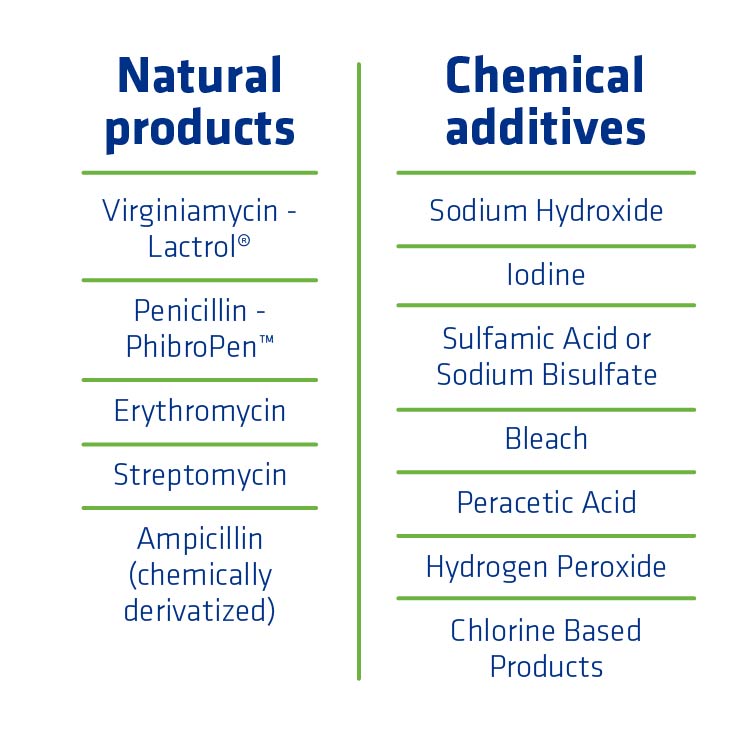
Natural Products: Antibiotics
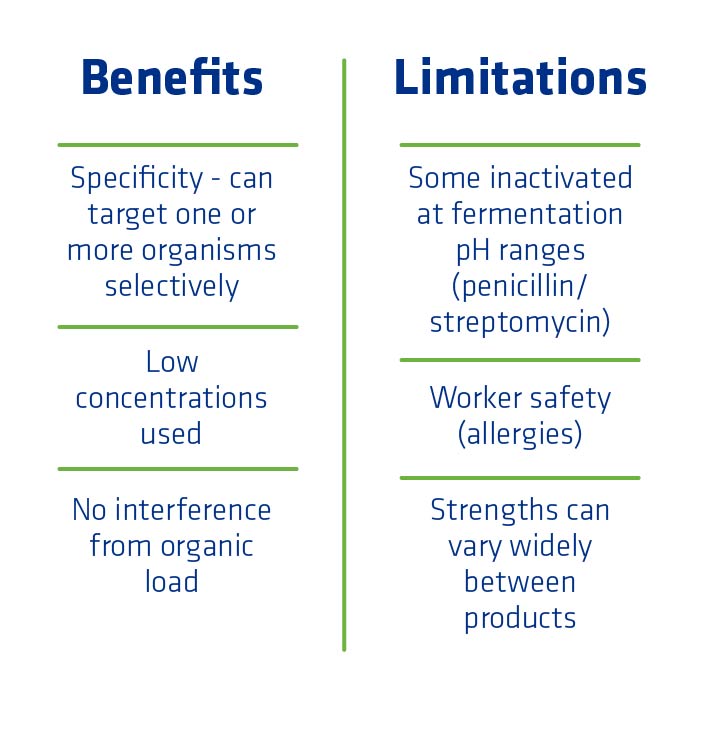
Antibiotics offer other benefits in addition to being highly specific. They can be used at very low concentrations and there is no impact on performance as a result of the organic load (i.e. solids). Antibiotics do have some limitations, however. Some are inactivated at lower pH levels. For example, antibiotics such as penicillin and streptomycin aren’t very stable at normal fermentation pH. Therefore, it is often best practice to use penicillin in combination with a second antibiotic.
In addition, antibiotics can lead to worker safety issues. Some people have allergic reactions to certain antibiotics. Plants should implement safety measures to protect workers who are sensitive. Also, product strengths can vary widely making it difficult to know the level of activity each product provides.
Product Information: Lactrol®
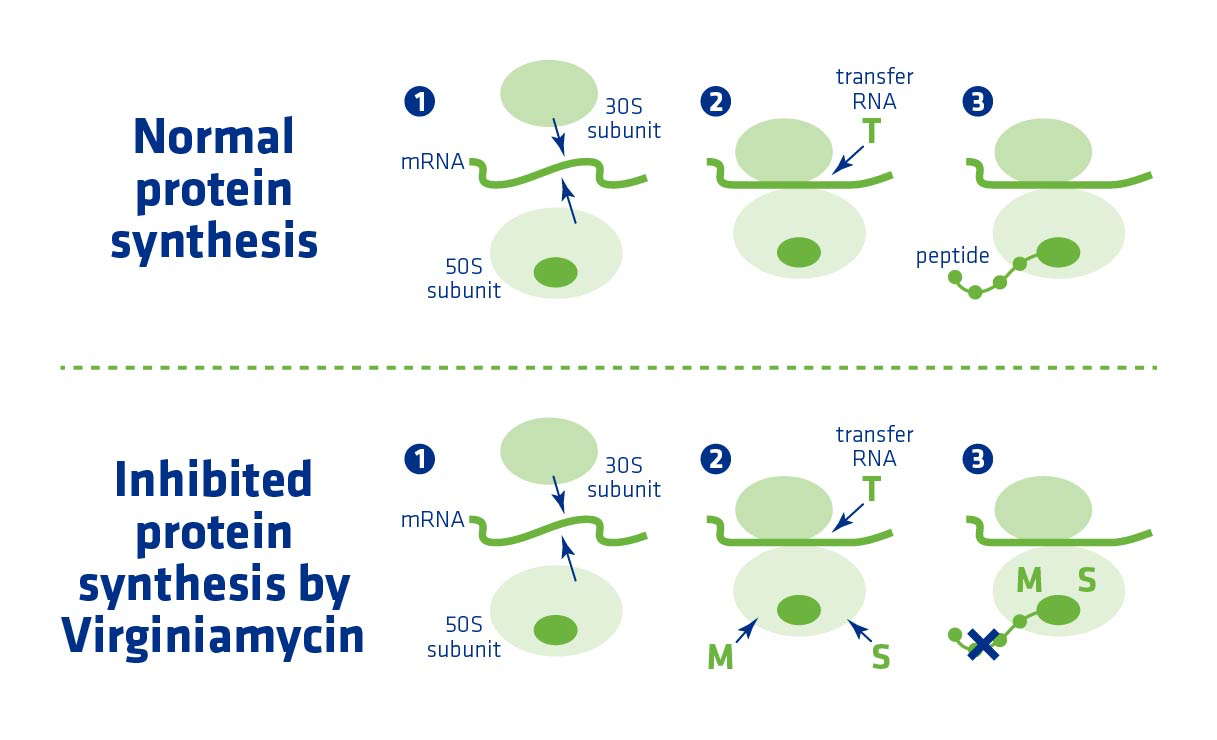
The antibiotic Lactrol has the highest concentration of virginiamycin of any on the market. Phibro is the sole manufacturer of virginiamycin in the world. Lactrol is Phibro’s flagship antimicrobial product. The virginiamycin molecule contains two components that work together (M and S Factors), making it difficult for bacteria to develop resistance. It is stable and active at a wide range of temperatures and pH, remaining active throughout fuel ethanol fermentation. When dosed correctly, Lactrol is denatured in distillation. An independent third party panel reviewed Lactrol and determined it to be generally recognized as safe (GRAS). This also makes Lactrol suitable for use under FSMA (Food Safety Modernization Act). Phibro has adopted this “Best in Class” philosophy when introducing additional supporting antimicrobial products such as PhibroPen™ and PhibroXact™. To see the entire antimicrobial and processing aids product lines go to ethanolperformancegroup.com.
Virginiamycin works by inhibiting protein synthesis in bacteria. The antibiotic binds to the bacterial ribosome where proteins are made. Like yeast, bacteria need protein to function. When virginiamycin binds to the ribosome, the bacterial cell can no longer make proteins and becomes severely disabled. These disabled cells can no longer make the enzymes needed for metabolism, and can no longer replicate, consume sugar, or make lactic acid.
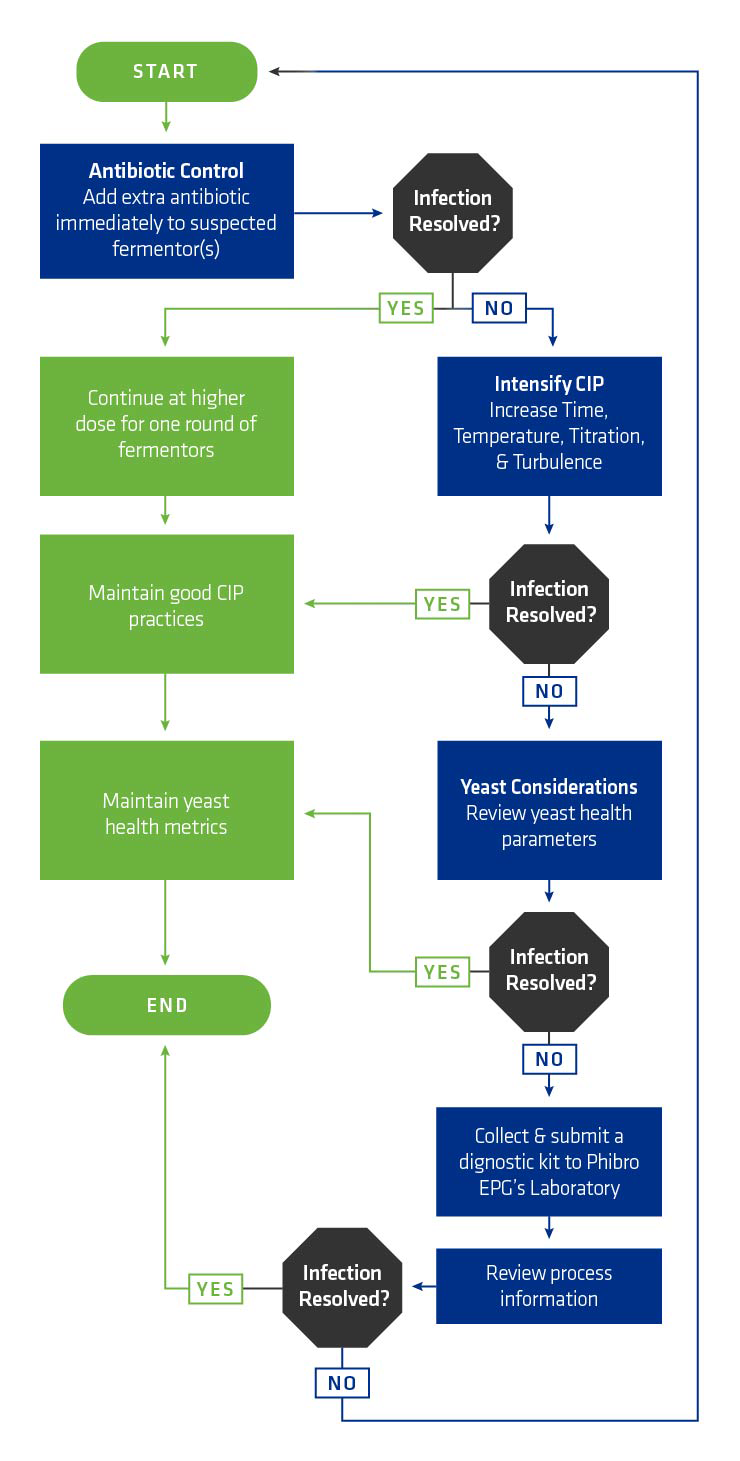
Infection Resolution Protocol
If a plant has followed all standard protocols and an infection is still present, Phibro’s “Infection Troubleshooting Guide” has been created for plants to help resolve the situation. An abbreviated flow diagram from this guide is shown in Figure 7. For each step, the guide has several questions for plants to answer that should help the infection investigation process. It should be noted that several of these steps can be occurring at the same time if needed. Plants should contact their Phibro EPG representative for the more detailed guide.
Case Study: Infection vs. Normal Comparison
An example from a plant that had some badly infected batches can demonstrate best practices for dealing with an infection.
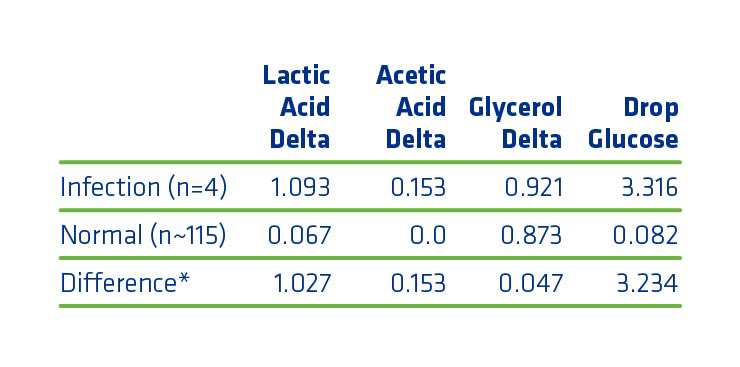
The first step involved determining how much lactic acid fermentation is producing—called lactic acid delta. Lactic acid delta is calculated by subtracting the first fermentation lactic acid value from the drop lactic acid value. The plant in question had as high as 2% w/v lactic acid delta, indicating a serious sporadic infection. Because the infection was so sporadic, there were only four batches throughout the data set that were infected. The table below (Figure 8) shows the average of these bad batches in comparison to normal plant levels.
To resolve the infection, Phibro Ethanol Performance Group made the following recommendations:
- Do not increase antibiotic dose because that can be impractical when the infection is sporadic.
- Review procedures and increase some CIP in specific locations, including the heat exchangers.
- Review plant data to try to make correlations.
Further data analysis and review discovered that, in some of the bad batches, there was higher lactic acid in the prop and a lower pH. That finding caused Phibro to examine the prop CIP more carefully during the on onsite investigation. While at the plant, a recirculation line off the prop line with a ball valve was found to be throttled during CIP, and as a result was cool to the touch (when it should have been hot during CIP). It was determined that this valve was likely sometimes throttled but then periodically opened during operations resulting in the sporadic several infections.
To avoid problems like this, plants need to implement detailed procedures that encourage compliance and consistency by writing a standard operating procedure (SOP) with a checklist for operators. The SOP should encourage operators to use all their senses as they CIP. Once the plant in this case study communicated to all operators and changed the SOP, the sporadic infections disappeared.
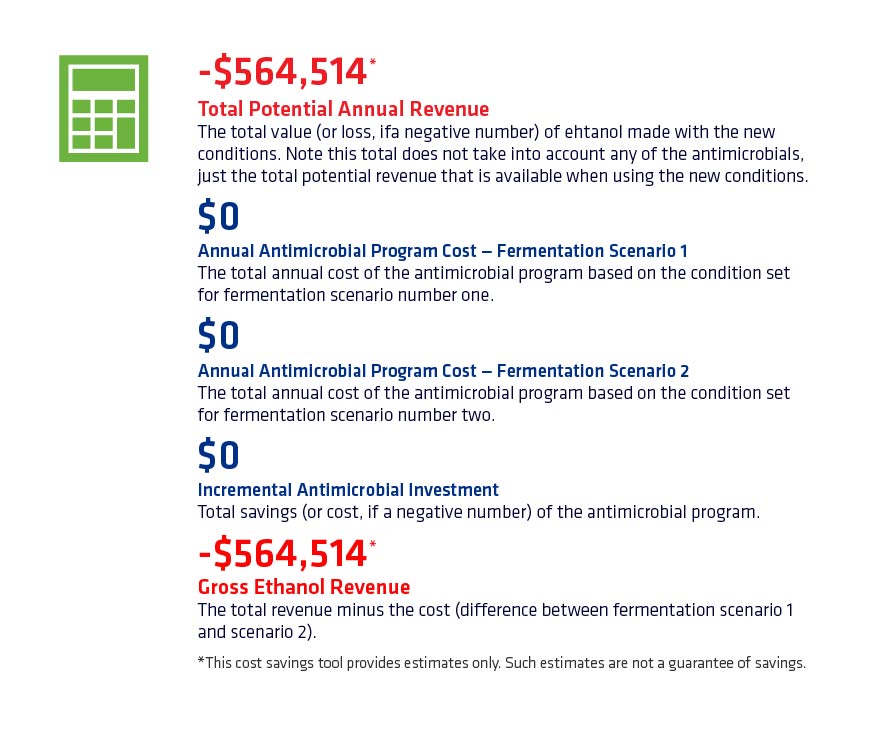
Economic Impact
To help plants determine the economic impact of infections like the one described above, Phibro offers an “Ethanol Value Calculator” that measures the cost of lost sugar/ethanol. Using the average values from the example above, periodic infections with similar lactic, acetic, glucose, and glycerol levels could have cost this plant almost $600,000 a year (assuming $1.30 price of ethanol). For more information on the Ethanol Value Calculator, contact your Phibro account manager.